Archive
How to troubleshot native memory leaks on Windows: GFlags and UMDH
 Memory issues are amongst the worst one to solve because pointing precisely the source is often difficult and painful. Memory leaks are not an exception, especially with real-world application: most of the time, programmers start to worry about it when the application outputs some “out of memory” errors. At this moment, you have to find which one, among thousands of functions and many more allocated blocks, causes the application to leak and eventually to crash.
Let’s summarize what you really need when you have a memory leak (in addition to a way to reproduce the issue):
- You want to find which object(s) are leaking
- You want to know why they are leaking: is there some static reference to it, or maybe they are not freed?
The process described today deals with the first one, which is often the most difficult.
Who the hell killed my process?
 There is a few reasons that can make a process disappear. It can be:
- a normal termination (you reach the end of the main function)
- a call to ExitProcess, potentially located anywhere in your code
- an exception walking up all through the call stack of its thread, making the process die.
How to debug a process as soon as it starts with WinDbg or Visual Studio 2010
 Sometimes bug happens before you have the chance to attach a debugger to the faulting process. Most of the time it’s because it is launched by another process (a service, the compiler used to create a Xml serializer of a .NET software, a batch script, etc.) and you don’t have the time to get the command line with ProcessExplorer. And even if you can get it, a process may expect some context coming from its parent. And obviously, sometimes you don’t have a clue about how a process is launched, all you know is that it crashes and you need to see what’s inside before it do so.
After a few tryout to pause the process (Process Explorer is your friend) before it crashes, or some tentative to slow down your computer so you have the time to attach a debugger, you’re starting to get frustrated. Hopefully I have some solutions for you.
How to break on a function only when a parameter have a specific value (without source code, in WinDbg or… Visual Studio 2010!)
 A few days ago, I had to break into a graphic application just after I clicked on a button. Sadly I didn’t have the source code, so my purpose was just to get the name of the applicative function called just after a user event (in my case, a click). Of course, when the function handling an event is called, I expect to see a Windows user mode function in the call stack. So I designed a small MFC application with just a button, made a function named OnBnClickedButton to handle clicks, added a breakpoint on this function, and tried to find on the call stack which function is always called when an application process an event.
I eventually found USER32!SendMessageW, and I was quite happy with it: this function is well-known for every MFC programmer because it allows you to send a Windows message to any application (including yours). A click on a button is of course a Windows message, and I was pretty sure I found my entry function. So I started the former graphic application, attached to it with WinDbg, and try to get the focus back to my application so I can click on the button. Sadly, my debugger broke before I could…why? Well, trying to put the focus on an application that is not visible triggers (at least!) a WM_PAINT message, processed by USER32!SendMessageW. And it is not the only one: a simple graphical continually receives A LOT of various messages. I clearly had to break only on a specific message. Hopefully the prototype of USER32!SendMessageW is well known: the second parameter is an unsigned int containing the message ID. Sounds nice, but how can you break on a function ONLY when a parameter have a specific value?
How to set breakpoints without source code in Visual Studio 2010
 As usual, I stumble upon a nasty issue while I was writing another post : create a native breakpoint on a function which I don’t have the source code. In Visual Studio 2010. In my case it was on User32.dll!SendMessageW, but you can experience the same difficulty for any other function if you are using symbol files without the path to the source code (as, by instance, public symbols of Microsoft…).
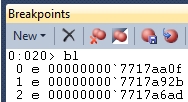
Of course, with WinDbg, nothing (well, almost) could be simpler: just get the name of your function with format <module>!<function name> (if you’re not sure about the name issue a “x <module>!*<part of function name>*” and search into the results), and then type “bu <module>!<function name>“, and you’re done. You can see here that WinDbg was designed to work without source code. It is definitely not the case of Visual Studio. So, how can you achieve this (simple) goal: break on a function without the source code?
Read more…
How to create and use a Custom COM Marshaler in .NET
 Microsoft has done a nice job when it designed Component Object Model, also known as COM, even if the system’s complexity was painful for some developers. To fix that, they first created Vb6 (well…no comment) to soften the burden of consuming COM objects, while C++ was still a little bit rough to use (but anything concerning COM was possible !). After a few years, they finally created the .NET framework. As a fair part of the Windows architecture was based on COM and COM+, they had to make the most popular language (C# and VB.NET) of the platform compatible with it. I’m currently working on a system where the .NET code use a lot of COM to communicate with other parts of the system, and I can tell you that even most of the features of COM can be used, sometimes you have to dig deeper to make .NET component compatible with other languages. I saw a few custom marshaler described on the net, but no one done to marshal an array of “anything” (called VARIANT in COM), so I thought it could be interesting to share it with others.
