How to break on a function only when a parameter have a specific value (without source code, in WinDbg or… Visual Studio 2010!)
 A few days ago, I had to break into a graphic application just after I clicked on a button. Sadly I didn’t have the source code, so my purpose was just to get the name of the applicative function called just after a user event (in my case, a click). Of course, when the function handling an event is called, I expect to see a Windows user mode function in the call stack. So I designed a small MFC application with just a button, made a function named OnBnClickedButton to handle clicks, added a breakpoint on this function, and tried to find on the call stack which function is always called when an application process an event.
I eventually found USER32!SendMessageW, and I was quite happy with it: this function is well-known for every MFC programmer because it allows you to send a Windows message to any application (including yours). A click on a button is of course a Windows message, and I was pretty sure I found my entry function. So I started the former graphic application, attached to it with WinDbg, and try to get the focus back to my application so I can click on the button. Sadly, my debugger broke before I could…why? Well, trying to put the focus on an application that is not visible triggers (at least!) a WM_PAINT message, processed by USER32!SendMessageW. And it is not the only one: a simple graphical continually receives A LOT of various messages. I clearly had to break only on a specific message. Hopefully the prototype of USER32!SendMessageW is well known: the second parameter is an unsigned int containing the message ID. Sounds nice, but how can you break on a function ONLY when a parameter have a specific value?
The first thing you have to know: how the stack is used when you call a function
To communicate the parameters to a function, most compiler mainly use the stack (if you don’t know what is this fundamental region of memory of your process called ‘the stack’, read this, this, and come back :) ). When you call a function, your process will:
- Push all the parameters value of the function in the stack, in reverse order. As a stack on x86 grows down in memory, it means that the first parameter will have the lower address and the last one the higher address.
- Push ‘the return address’ of the function. It is just a pointer to the next instruction after the call, so the function can do a ‘goto’ (more precisely a ‘ret’, who is just a ‘goto’ to a particular address retrieved from the stack) to this address when its execution is finished. Maybe you didn’t know it, but a processor does not understand the ‘return something’ of a function. What a processor understands is goto’s, and quitting a function is just a ‘goto’ to another function. Maybe you tried all your life avoiding goto’s in your code (and specially TO ANOTHER FUNCTION! SIGH!), then you may be shocked to learn that the compiler doesn’t care about it: if you don’t want to execute the very next instruction, it will issue a ‘jump’, a ‘call’ or a ‘ret’, just other names for a goto. Pretty sad.
- Call the function, in other words…issue a goto! For convenience, the last two steps are made by a single well named instruction: ‘call’.
Let’s say that we call a function Foo from a function Bar, with 3 parameters, something like this in C++:
void Bar()
{
	Foo(1, 2, 3);
}

void Foo(int p1, int p2, int p3)
{
	// I'm so called!
}
Here is how looks like the pseudo-assembler code of Bar when it calls Foo (I chose randomly the address in memory):
Address of the instruction	Assembler instruction
 in memory
0x00010000			push 3
0x00010001			push 2
0x00010002			push 1
0x00010003			push 0x00010005
0x00010004			Goto Foo
0x00010005			// do what you have to do next
In the real world, the last ‘push’ and the ‘goto’ is made by a simple instruction named ‘call’, but the main principles are here. So, when I enter the function Foo, my stack looks like this (again, I chose randomly the address in memory, the point is that it is not the same than the previous one):
Address in memory	Value
0x30000000		0x00010005    <- where I will 'goto' at the end of Foo
0x30000004		0x00000001    <- my first parameter
0x30000008		0x00000002    <- my second parameter
0x3000000C		0x00000003    <- my third parameter
Now you know everything about a proper function call on x86. The last thing I have to say is that the processor use a special register to store the current memory address of the stack: ESP. That is to say, just after calling Foo, ESP has the value 0x30000000.
I made the (huge!) effort to read all this stuff until know, please give me the trick now
Well, we almost get the answer now: to get the value of the nth parameter, we have to check the value of (ESP + 4*n) if I start counting parameters at 1. Just remember a few things:
- On x64, each address is 8 bytes, so the formula is (ESP + 8*n)
- If your function is a class function, remember that each member function has a first hidden parameter: ‘this’.
- Sometimes, compiler optimizations make this formula wrong…but if you read carefully the first chapter, you can always find the right address for your particular function. Just use the Memory, the Registry and the Disassembly windows of your debugger.
The trick on WinDbg
WinDbg can (obviously) execute a command when it hits a breakpoint with the following syntax :
bu <breakpoint address> "<command>"
All you have to do is writing the command. For this one, here is what you need to know:
- The value of the register XXX is accessed by using the character ‘@’ before the name, in other words @XXX
- The content of a given address is accessed through the function poi(address) (like ‘pointer’ I guess???)
- The basic if-then-else can be written like this: j (condition) ‘action if true’ ; ‘action if false’ (j like ‘jump’ in assembler, also a guess)
- Resume the execution of the debugger is gc (for go!). EDIT: as said Jean-Jacques in the comments, you should always use gc instead of g in conditional breakpoints, so the debugger can resume in the same way it arrived at you breakpoint: by continuing, or stepping, etc.
To put things together, if I want the debugger to break only when the second parameter of the function USER32!SendMessageW is 0x111, I have to issue the command:
bu USER32!SendMessageW "j (poi(@esp+8)=111) ''; 'gc'"
Easy :)
The trick on Visual Studio 2010
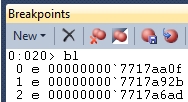
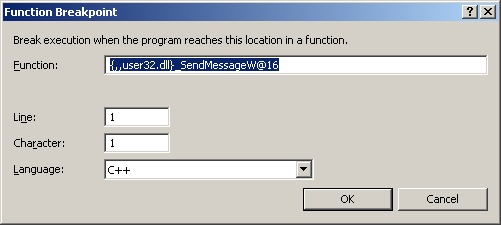
I realized that I wrote only a little about Visual Studio, so I searched how to realize that, and it is possible! First you have to set a breakpoint on the function. As we don’t have the source code, things are pretty hard and I just made a post about how to do it on Visual Studio 2010. If you read it, you know that you have to display the Breakpoint window (CTRL+ALT+B by default, or Menu Debug->Windows->Breakpoints), click on the button New->Break at function… (or type CTRL+B), and fill the popup windows with the context operator {,,user32.dll} _SendMessageW@16, like this:
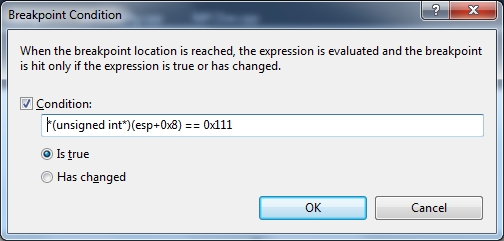
Then we have to add a condition to this breakpoint. To do so, right click on the newly created breakpoint and hit “Condition…“. We have to write pretty much the same thing than we did with WinDbg, except that keywords and conventions are different:
- The value of the register XXX is simply accessed using XXX
- By default , number literal are decimal, so we have to use ‘0x’ before any hexadecimal number
- There is no ‘get the value pointed by’ function in Visual Studio, but you can cast a value to an ‘unsigned int*’ then get the referenced value using the C++ operator ‘*’
Given that, the condition can be written like this: ‘*(unsigned int*)(esp + 8) == 0x111‘, as illustrated in this screenshot:
Then here you are: a breakpoint on a function without source code, breaking only when a given parameter has a specific value. In Visual Studio 2010. Not easy, but feasible.


Actually, you should use ‘gc’ rather than ‘g’ on the uninteresting cases. Else if you’re stepping and the breakpoint is triggered during a ‘n’ (it could have been called deeper, or on another thread), the ‘g’ “kills” your stepping…
teDyYT Good point. I hadn’t thought about it quite that way. :)
Tks Jean-Jacques, I updated the post following your advice. It’s true that it can be a little bit disappointing when you reach the breakpoint after a looooooong debugging session, hit F10 to step….and the execution just go on :)
Is it possible to break windbg when ecx register is set to some value. Basically i want to check ecx register with some constant ? i dont want to break on any specific function (like bu USER32!SendMessageW) instead i want windbg to stop execution whenever the ecx register has value say 0x00000000.
I’m getting Access violation exception and its happening when the call instruction tries to access ecx register which is pointing to invalid memory. I want to know is changing the ecx register. If i see in windebugger i see ecx = ????????.
Any thoughts
Hi Ram
There is two kind of breakpoint: the classic one, that allows you to break when a specific assembler instruction is about to be executed, and “breakpoint on access”. The latter breaks the debugger when a specific region of memory is read or written.
For your specific needs, I would recommend to use the first one. Here is what you can do: step to the assembler instruction where you want to break only when ecx is 0x0. In the Dissassembly window, look at the instruction address on the very left column, let’s say it’s 76f80fa5. In the command window, type:
bu 76f80fa5 “j (@eax=0) ”; ‘gc'”
Now, the debugger will break on this instruction when eax is 0.
About the “If i see in windebugger i see ecx = ????????.” part: where are you seeing this? A register have always a readable value, even if this value can point to an invalid address. If you can send me a dump, I can have a look and help you further.