How to set breakpoints without source code in Visual Studio 2010
 As usual, I stumble upon a nasty issue while I was writing another post : create a native breakpoint on a function which I don’t have the source code. In Visual Studio 2010. In my case it was on User32.dll!SendMessageW, but you can experience the same difficulty for any other function if you are using symbol files without the path to the source code (as, by instance, public symbols of Microsoft…).
Of course, with WinDbg, nothing (well, almost) could be simpler: just get the name of your function with format <module>!<function name> (if you’re not sure about the name issue a “x <module>!*<part of function name>*” and search into the results), and then type “bu <module>!<function name>“, and you’re done. You can see here that WinDbg was designed to work without source code. It is definitely not the case of Visual Studio. So, how can you achieve this (simple) goal: break on a function without the source code?
I want to break on some Managed function in Visual Studio 2010
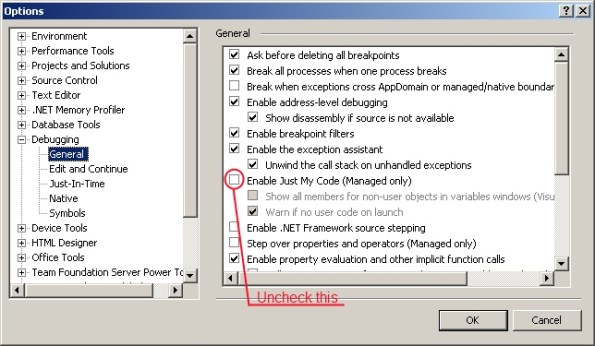
This is pretty simple, as explained in this post. First thing you have to do is configure your visual studio to remove the infamous “Just My Code” feature. Go to menu Tools->Options…, choose Debugging\General in the left panel and uncheck the “Enable Just My Code (Managed only)” option:
IMHO, this option should be left unchecked, because even if in a few cases it can avoid you to break on exception that you don’t care about, it hides EVERYTHING happening outside your code, so you miss all exceptions in every third-party framework.
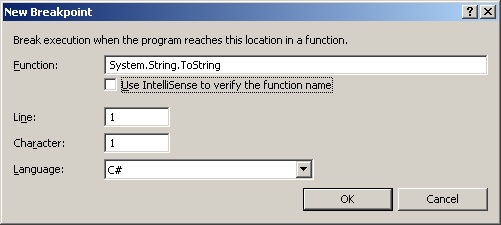
Now you’re ready to add your breakpoint (at the opposite of what said Aaron Lerch in his excellent post, you don’t have to configure symbols to break in some managed function, the CLR can handle this by itself). Let’s say that we want to break on the function ToString() of the built-in type String, whose full name is System.String.ToString.
Open the breakpoint windows (CTRL+ALT+B by default, or Menu Debug->Windows->Breakpoints), click on the button New->Break at function… (or type CTRL+B), and fill the popup windows like this:
If you didn’t make a mistake on the function name spelling, you should break on each call of this function. Just check that you got the full red circle next to your newly added breakpoint in the Breakpoints windows.
I want to break on some Native function in Visual Studio 2010
This is way more difficult. First, you HAVE to retrieve the symbol of you module. You can do whatever you want, without a symbol file you’re stuck.
To specify the exact function where you want to break, the MSDN documentation states (in some hidden page) that you can use a ‘context operator’ that can have three different syntaxes:
- {[function],[source],[module] } location
- {[function],[source],[module] } variable_name
- {[function],[source],[module] } expression
Except if you have the source code (in which case, why would you try to use this **#&* syntax?), none of those will work. I didn’t try myself every combination, but Ofek did it on his post, and his conclusion (and mine to) is that this one do the job:
- {,,<module name with its extension>}<decorated name of your function>
Remember that in my case, I want to break on the function User32.dll!SendMessageW. Even if the <module name with is extension> is pretty straightforward for this one, what the hell is the decorated name of the function? It is the name that the compiler uses to expose the function, and it has more characters than just the name (it’s also called mangled name) to handle overloads, calling convention, etc. And how can you find this decorated name? The easy way, if you can, is to stop on the Visual Studio debugger, trying to have the function in your call stack, like this:
Here you can see that the name for Visual Studio waits for: _SendMessageW@16. Lucky boy, you can go straight to the next paragraph.
For all the others: you need to use a small utility named DBH.exe, that you can download with the Debugging Tools for Windows (I was pretty sure that I could achieve this with DumpBin, but I failed, so sad). Once you get it, the operation can be made in two steps, pretty well explained in this half-hidden MDSN page. Step one, call the utility once to get the address of the symbol (it’s where you need the symbol file!):
C:\DebuggingTools>dbh -s:srv*C:\Symbols*http://msdl.microsoft.com/Download/
Symbols -d C:\Windows\System32\User32.dll enum *SendMessageW*
Symbol Search Path: srv*C:\Symbols*http://msdl.microsoft.com/Download/Symbols

 index            address     name
     1            1061054 :   __imp__WinStationSendMessageW@40
     2            105e323 :   _WinStationSendMessageW@40geW@40
     3            105e317 :   __imp_load__WinStationSendMessageW@40
     4            10191b3 :   _SendMessageWorker@20nSendMessageW@40
     5            101929a :   _SendMessageW@16er@20nSendMessageW@40
The arguments are pretty straightforward, except maybe:
- -s:srv*C:\Symbols*http://msdl.microsoft.com/Download/Symbols : classic symbol path used to retrieve the matching symbol on the microsoft server of my user32.dll file
- -d : use decorated publics
- enum *SendMessageW* : display all names matching the mask *SendMessageW*
Let’s have a look at the result: a list of decorated function names, where you can recognize (at least at the beginning) ours, _SendMessageW@16er@20nSendMessageW@40, with index 5. But this name is the full decorated name, and it’s not the right one yet, damn! Here comes the step two, where you have to call again DBH.exe, giving the address next to your function, 101929a in our case, with the command addr:
C:\DebuggingTools>dbh -s:srv*C:\Symbols*http://msdl.microsoft.com/Download/
Symbols -d C:\Windows\System32\User32.dll  addr 101929a
Symbol Search Path: srv*C:\Symbols*http://msdl.microsoft.com/Download/Symbols

_SendMessageW@16
   name : _SendMessageW@16
   addr :  101929a
   size : 0
  flags : 0
   type : 0
modbase :  1000000
  value :        0
    reg : 0
  scope : SymTagNull (0)
    tag : SymTagPublicSymbol (a)
  index : 1
The long-awaited name is written at the beginning : _SendMessageW@16. We did it!
Ok I got the decorated function name, what’s next?
As we know the working syntax of the context operator, we can now write it: {,,user32.dll} _SendMessageW@16. Just open the breakpoint windows of your Visual Studio (CTRL+ALT+B by default, or Menu Debug->Windows->Breakpoints), click on the button New->Break at function… (or type CTRL+B), and fill the popup windows like this:
Hurray! We did it!
Conclusion
If you’re brave enough, Visual Studio can be used to accomplish the same work than WinDbg…but sometimes it’s a pain. I think this trick is useful when you already have a Visual Studio attached to your software, or when you want to teach some debugging tips to developers who don’t want/like/use WinDbg. As a friend told me, “sometimes it’s better to improve the use of an existing tool instead of learn a new one”. I let you decide!


There is a slightly simpler way.
1. get address offset OFF by dumpbin
2. in VS, attached to process, open “Modules” window. Find your module and take first number ADDR from Address columnt
3. Open Disassembly windows and type ADDR + OFF to “Address:” you can just type expression
4. You can see the function beginning
5. Put your breakpoint as you used to do it in VS
nice trick max630, tks !
@max630 thx for the trick… that is insane…!
Is there a way to just specify an offset to a function address? Say, the location when it is about to return so I can output the returned value?