Who the hell killed my process?
 There is a few reasons that can make a process disappear. It can be:
- a normal termination (you reach the end of the main function)
- a call to ExitProcess, potentially located anywhere in your code
- an exception walking up all through the call stack of its thread, making the process die.
Your operating system is Windows Vista or Windows Server 2008
Well I’m very sorry for you guys, but the only solution I know is kernel debugging, and as I’m complete newbie to it, I will not give you any way on how to do it. But my first advice would be to download the Debugging Tools for Windows, put the system on a virtual machine (or buy another PC) and start digging the NT Debugging Blog.
Your operating system is Windows 7 or Windows Server 2008 R2 (or higher I guess…)
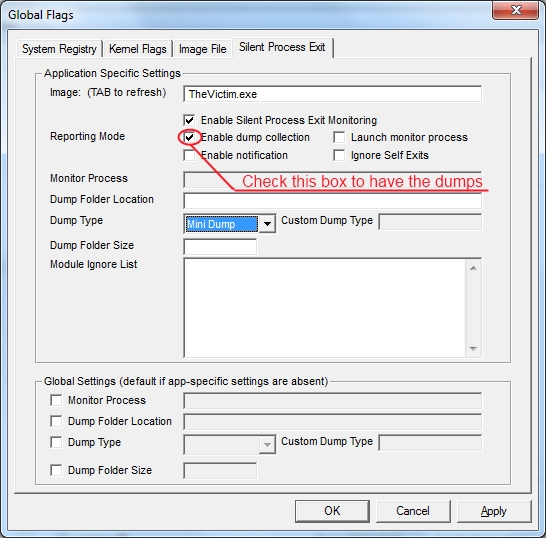
Now we can talk. It appears that the last version of the Debugging Tools for Windows is shipped with a version of GFlags that add a new tab: ‘Silent Proces Exit’. No documentation is available for the moment, but the options are pretty clear, just fill in the boxes like that:
Now start your process, kill it with another one, and a new event will appear in the Event Manager (type eventmgr.msc to start it) in the ‘Application’ section, looking like that:
And voilà, you got the name of the killer, and of course the name of the victim.
This is not enough: I want full details about the killer, and also what was the victim doing when it dies.
Well, as you may have noticed by looking at the GFlags options, it can be easily done:
This configuration will create two dumps in %TEMP%\Silent Process Exit, under a directory named with the name of the ‘victim’, its PID and a number who seems to be related to the date and time:
This gives only MiniDumps, but it’s enough for most common troubleshooting investigations. I tried to play with the other options (‘Dump Folder Location’ and ‘Dump Type’) but none seems to have any effect. I don’t know if it is a bug of a misuse, let’s hope that some documentation will soon enlighten those parts.
-
November 4, 2011 at 4:44 amGFlagsでプロセスを殺した犯人捜し | troushoo
-
December 28, 2011 at 2:59 amWindows Debugging tricks – who killed my process? | MSDN Blogs


