How to debug a Windows service
 Maybe you thought when you read this title: “well it’s kind of easy, I just have to attach any debugger to my running service“. And you’re definitely right.
But sometimes you have to debug the very beginning of your service (just after the “Start” control), or even before, when the main() function has just started. Or you’re experiencing a bug that happens only with a specific user, or only in a context of a Windows service (could be environment variables, registry keys, etc.). Hopefully, with a few tricks, you can easily setup a debugger that will attach to a process just after its creation.
How do I attach a debugger as soon as a process is started?
As a service’s process is started by “services.exe“, which is a vital process for Windows, we have to do a little trick to tell the OS: “always starts this executable with a debugger attached”. Of course we could attach WinDbg to “services.exe”, and tell him to debug also created child processes. Besides the fact that we will debug all other processes launched by it, there is a big drawback with this method: Windows does not really like when you’re messing with a vital process (I already had blue screens while trying to do that…), and your OS session can be ruined if you make just a simple mistake. I warned you.
I know a much better trick: just start the utility “GFlags.exe” available in the “Debugging Tools for Windows” package. It is a simple tool with a lot of nice features (some are a little bit complex to understand, see here for a detailed documentation) including the ability to force the operating system to attach a debugger at the very beginning of a given process.
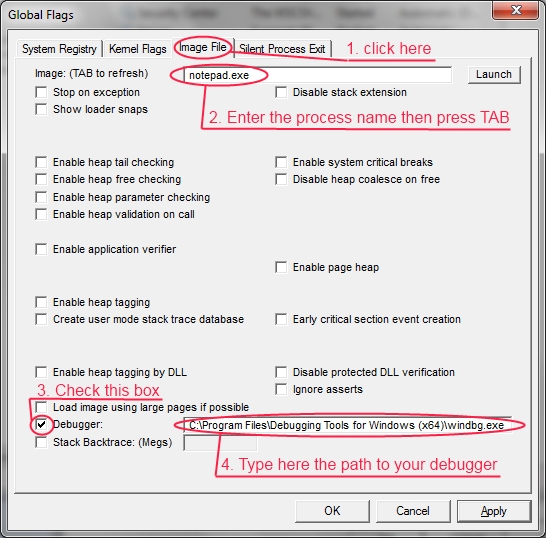
Just start “GFlags.exe” (you should have this kind of windows with some subtle variations depending on the version of the debugging tools that you are using) and follow the steps in red:
I choose here to use WinDbg to debug all instances of “notepad.exe” created. You can test it now : start notepad the way you want and you should see WinDbg pop-up. Nice isn’t it?
To cancel it, just uncheck the check-box of the step 3 after you entered the process name with same steps then 1 and 2. In case you forgot which processes are currently in this mode, you should know that GFlags is just creating registry keys to achieve its goal. By looking at:
HKEY_LOCAL_MACHINE\SOFTWARE\Microsoft\Windows NT\CurrentVersion\Image File Execution Options\<your process name>
you will find a string value named “Debugger” : just delete it and you’re back to a regular process launch.
Now I know how to attach a debugger as soon as a process start, but I can’t see my debugger when I use this trick on a service.
That’s perfectly normal : the service processes are not bound to a windowed session, and all processes started by “services.exe” cannot interact with your desktop, unless you check the box “Allow the service to interact with desktop” in your service properties, which can help you a little bit, but you can’t keep the former user name. Quite difficult to debug user permission issues…
So what can I do?
Use remote debugging! In the same “Debugging Tools for Windows” package you can also find “cdb.exe“, which is a command-line debugger using the same engine than WinDbg. To start it and make it wait for a remote debug session, just use this command line:
cdb.exe -server npipe:pipe=<my debug session> <my process path>
Enter anything you want for <my debug session> (just make sure to enter different things for each debugging session you are doing on the same computer). You can also use a different transport than pipes to communicate, but this choice is very fast and easy.
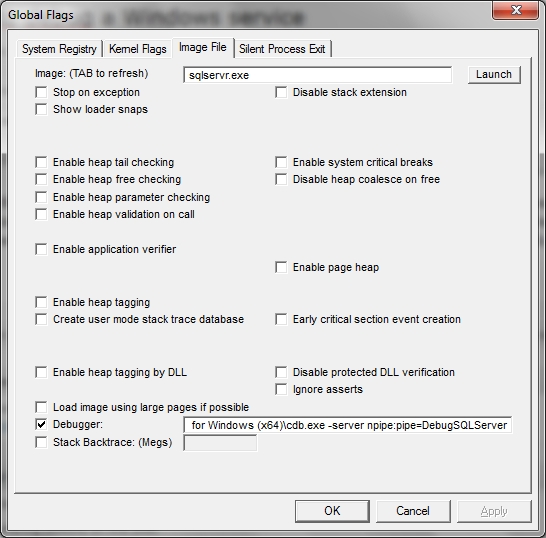
As GFLags will automatically add the full process path at the end of the string you entered in the debugger path text box, to debug the service “SQLServr.exe” you should ends with something like that:
As you can see I named my debug session “DebugSQLServer” but you can choose anything instead (did I already told this?). The start of the string typed in the debugger check box is not visible, but it is the end that matters. You can now try start the selected service; you should see a “cdb.exe” instance running (use the task manager, or even better ProcessExplorer).
And how do I connect to this invisible cdb.exe?
By using any debugger from the Debugging Tools for Windows package, including “Cdb.exe” or “WinDbg.exe“. My choice would be to use the second one (well, a little bit of graphical stuff is not bad) and connect to the session by using the menu “File -> Connect to remote session…” and enter “npipe:server=localhost,pipe=<my debug session>” in the message box. As you can see you can also connecting to another computer if you change “localhost” by the name of the distant one.
That’s cool! But after a few moments, the service controller starts complaining about timeouts and stop my process!
The service controller has indeed a timeout for each action it sends to a service. Hopefully you can tweak it by going to the following registry key:
HKEY_LOCAL_MACHINE\SYSTEM\CurrentControlSet\Control
and typing a new DWORD key value named “ServicesPipeTimeout” and setting its value to the amount of milliseconds the system should wait before entering in timeout state for each command send to the service. 300000 (5 minutes) should be sufficient for short debug sessions, but you can basically enter any number you need. Just beware that there is a unique value for every service of your system! By changing it, you also change the behavior of all other services.
It’s almost finished: you just have to…reboot, as the Service Control Manager reads this value only at startup :(. And don’t forget to put it back to its former value (or delete it) next time!
-
April 3, 2011 at 4:09 pmHow to debug a process as soon as it starts with WinDbg or Visual Studio 2010 « BugSlasher
-
March 20, 2014 at 7:49 amHow to capture a crash dump during application startup | Web Debug

